
The Inspect tool in Meta Ads Manager is one of the most useful for diagnosing performance issues in ad sets — and one of the most underused. While most advertisers limit themselves to reviewing cost per result and ROAS, Inspect lets you understand why those numbers are changing.
- Where to find the Inspect tool
- What the Inspect tool monitors
- Overview
- Auction competition
- Audience saturation
- Auction overlap
- Significant edits history
Where to find the Inspect tool
To access your audience reach statistics, go to Meta Ads Manager, navigate to an ad set, and click “Inspect”.

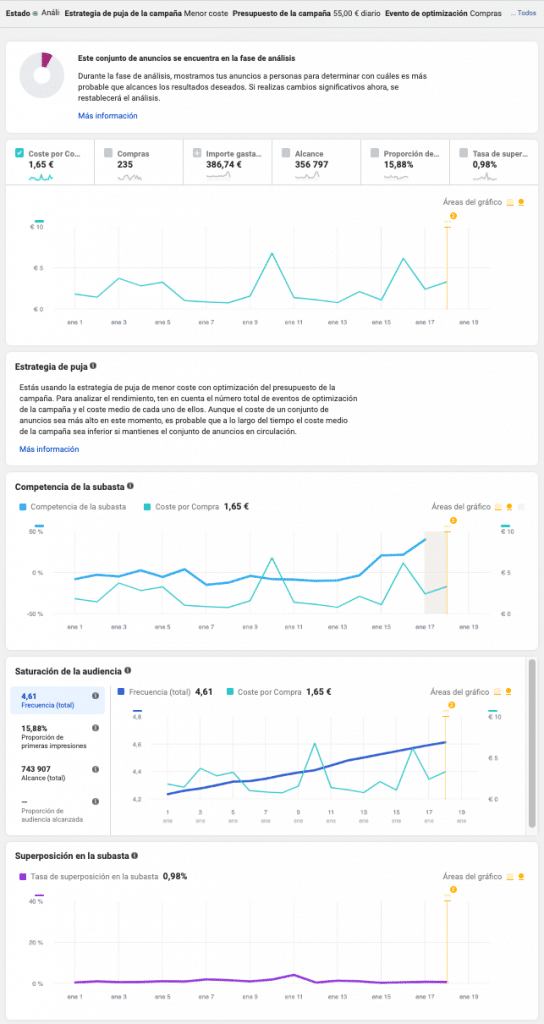
You should see a panel like this. By default, the graph shows the evolution of cost per action (cost per purchase in this example).
The Inspect tool is currently available for ad sets with the following objectives:
App installs · Lead generation · Traffic · Conversions
What the Inspect tool monitors
Inspect helps you understand how your ads are behaving in relation to:
- The level of auction competition
- The frequency of delivery to your selected audience
- Audience overlap across different ad sets
- The significant edits history that has affected campaign learning
If you want to spend your advertising budget effectively, these four indicators are the ones that matter. Let’s go through each one.
Overview
At the top there is a graph representing over time:
- Cost per action (visit, purchase, lead…)
- Number of actions
- Amount spent
- Reach
- First impression ratio
- Auction overlap rate
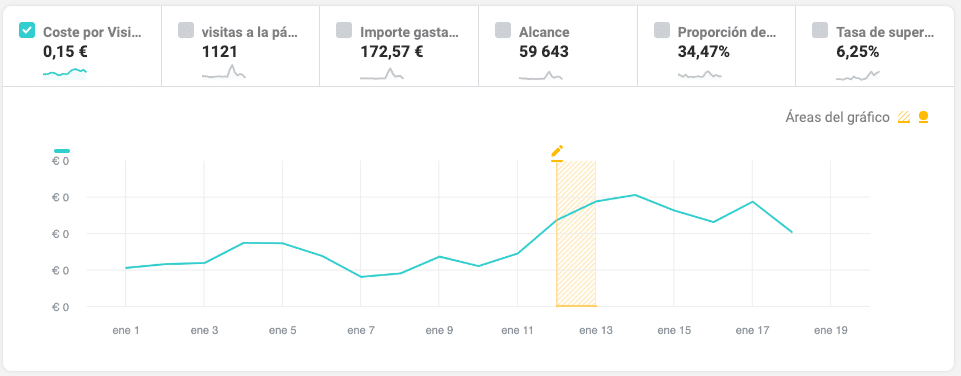
The graph lets you view these data points individually or all at once. Simply tick the box next to the data you want to see.
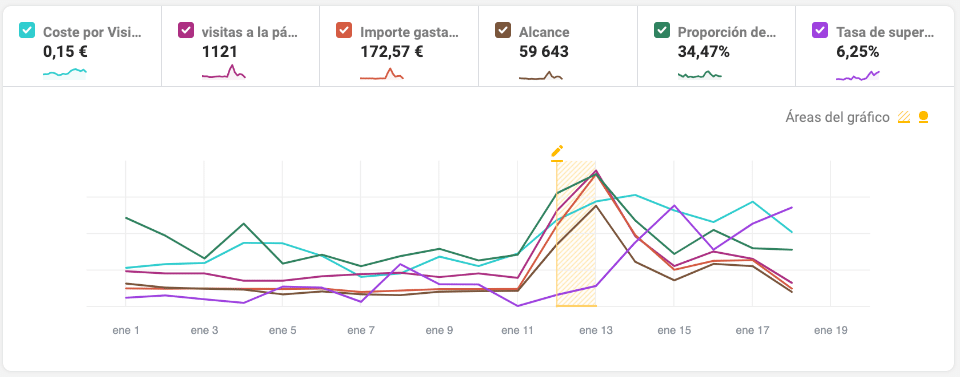
If you observe a performance drop, this graph can provide useful indicators to guide your diagnosis.
Auction competition
Advertising on Meta works through a bidding system. Each advertiser sets a budget (a bid) and an algorithm decides who wins the auction — whose ads are shown to the audience.
When competition is high, the only way to guarantee your ads are delivered is to raise your bid. This can lead to a satisfactory level of conversions, but with a cost per conversion so high that the campaign stops being profitable.
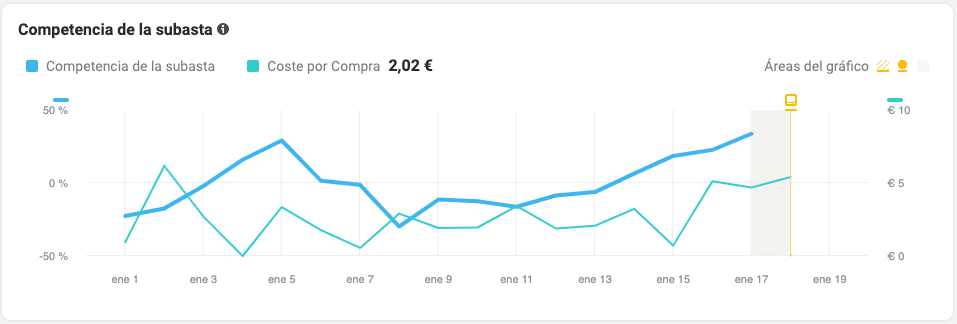
The auction competition graph lets you see the level of competitive pressure in real time and make adjustments (to audience, delivery schedule, or objective) so your ad set faces less competition.
Audience saturation
Are your ads underperforming? A common cause is high delivery frequency. If an Instagram or Facebook user sees the same ad repeatedly, they may mark it as “spam”, “irrelevant”, or “repetitive”. Meta will progressively stop showing it to them.
In the audience saturation panel, you can see the frequency of delivery and the CPA (cost per action) on the same graph. When you observe a correlation between high CPA and high frequency, you’ve found the problem.
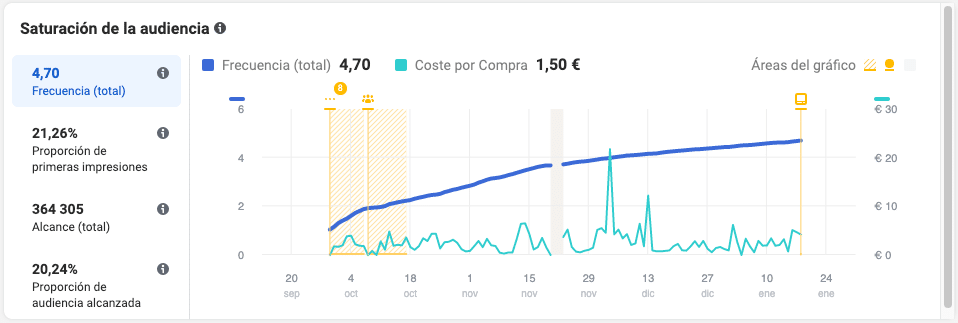
In this example, frequency rises but CPA remains at adequate levels — the audience is not yet saturated.
The saturation table helps you recognise whether ad fatigue is contributing to a performance drop.
You can also see the first impression ratio compared to cost per action.

This shows the percentage of people seeing this ad for the first time each day. In the example, the proportion dropped at the start but stabilised around 20% throughout the ad set’s life.
You can also track how Reach evolved over time.
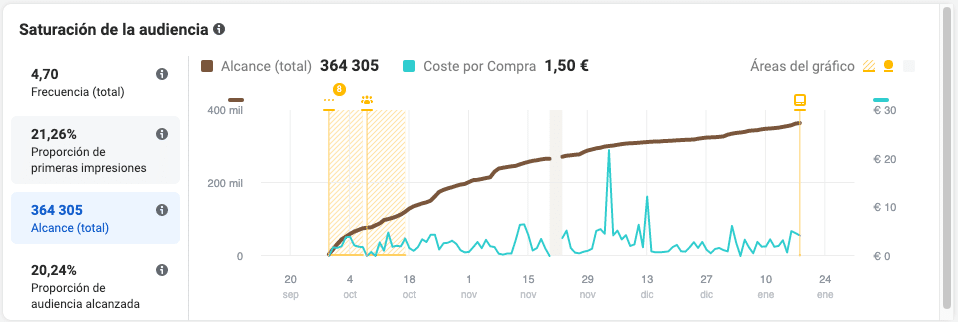
Reach is growing at a steady pace, which suggests the audience is not saturated. If it were, the line would start to flatten.
The audience reached rate shows the percentage of your potential audience you have reached so far.
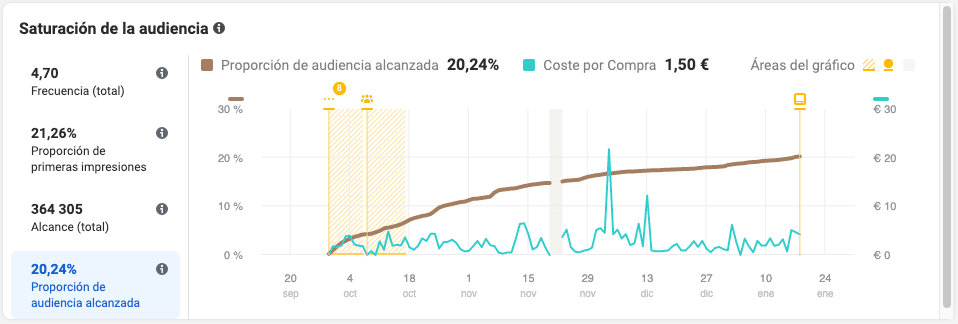
In this example, the ratio is low — around 20%. This indicates that ad fatigue is not setting in yet. The ad set can keep running or even scale budget.
Auction overlap
When you run multiple ad sets simultaneously targeting the same audiences, you become your own competitor. Meta’s algorithm compares the bids of all ad sets as if they were separate entities — and sometimes one of your ad sets wins the auction at the expense of another.
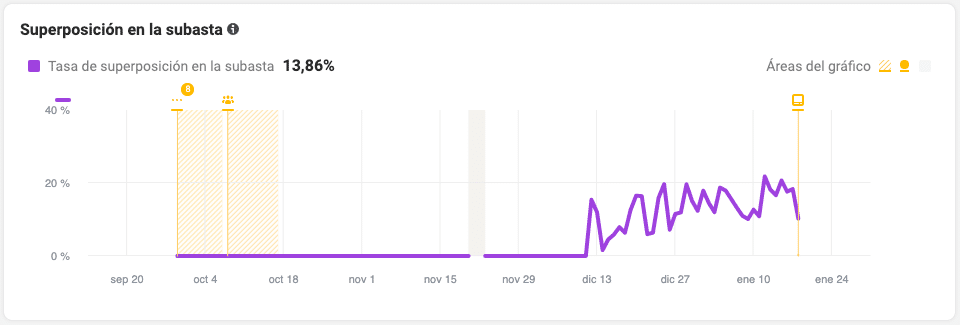
With auction overlap, you can see to what extent your ad sets are competing against each other. The simplest solution is to differentiate audiences or delivery schedules between ad sets.
In the example, the ad set ran for a long time without any overlap, but in recent weeks it reached up to 20%. That’s a clear signal that audience structure needs reviewing.
Significant edits history
Meta needs time to analyse your ads and establish auction winners during the learning phase. Every time you make significant changes to an ad set (budget, audience, creatives) the algorithm partially resets that process.
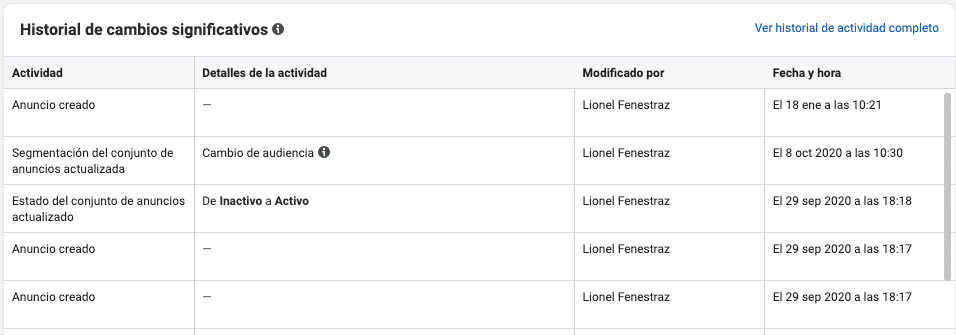
In this section you’ll see the ad sets with the most edits. Reviewing what changes you made, and when, helps you understand whether a performance drop coincides with an edit that reset learning. It also teaches you to improve your initial setup to avoid so many modifications in the future.
If you’d like help interpreting Inspect data in the context of your full account, book a free audit. In 30 minutes we review campaign structure, auction competition, and audience saturation.